
17,458 leads from Meta Ads at $2.27 each
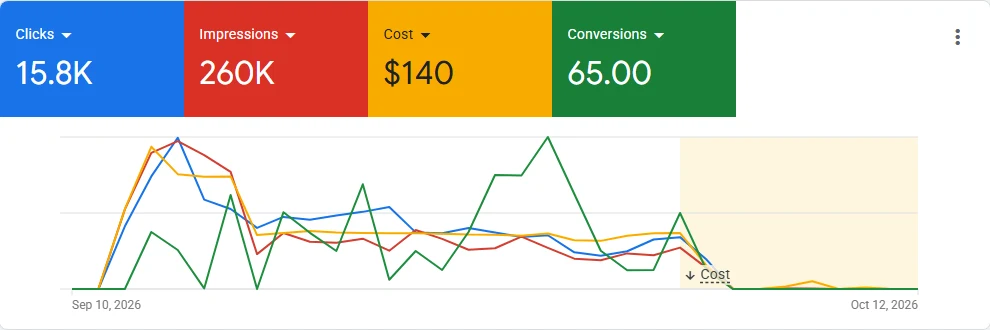
Across 105 Meta ad sets, Dreamway Holdings got 17,458 leads and 3,584 messaging conversations. A Google Demand Gen campaign added 65 conversions for $140.
Meta AdsLead formsGoogle AdsDemand GenSEOReal estate
Across 105 Meta ad sets, Dreamway Holdings got 17,458 leads and 3,584 messaging conversations. A Google Demand Gen campaign added 65 conversions for $140.
Dreamway Holdings Ltd develops and sells property. Buying property is a big decision, so the company needed to reach a large audience cheaply and turn interested people into real enquiries.
The goal was to build awareness and generate conversions on a small budget.
I ran lead, messaging, traffic, video, engagement, page-follow and reach campaigns for Dreamway Holdings on Facebook and Instagram. Lead ad sets averaged $2.27 per lead, and messaging ads started 3,584 conversations with interested buyers at about $0.37 each. The biggest lead ad set alone brought 3,981 leads at $1.99 each.
| Goal | Results | Spend | Cost per result |
|---|---|---|---|
| Leads (lead forms + Meta leads) | 17,458 | $39,693.02 | $2.27 |
| Messaging conversations | 3,584 | $1,337.86 | $0.37 |
| Landing page & content views | 15,846 | $221.11 | $0.01 |
| Video ThruPlays | 90,453 | $91.80 | $0.001 |
| Post engagements & interactions | 180,159 | $312.47 | $0.002 |
| Page follows & likes | 32,806 | $562.45 | $0.02 |
| Reach campaigns | 4.6M+ people | $420.23 | $0.09 per 1,000 |
| Total | – | $42,638.94 | – |
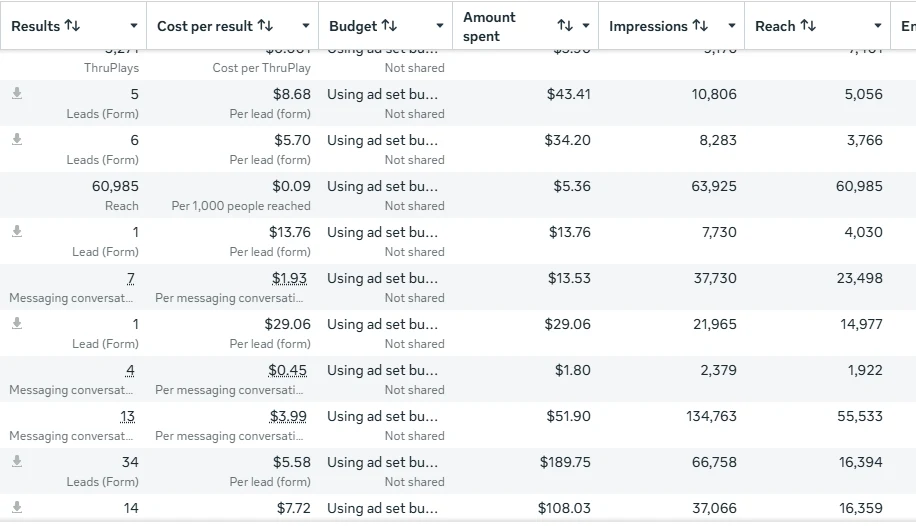
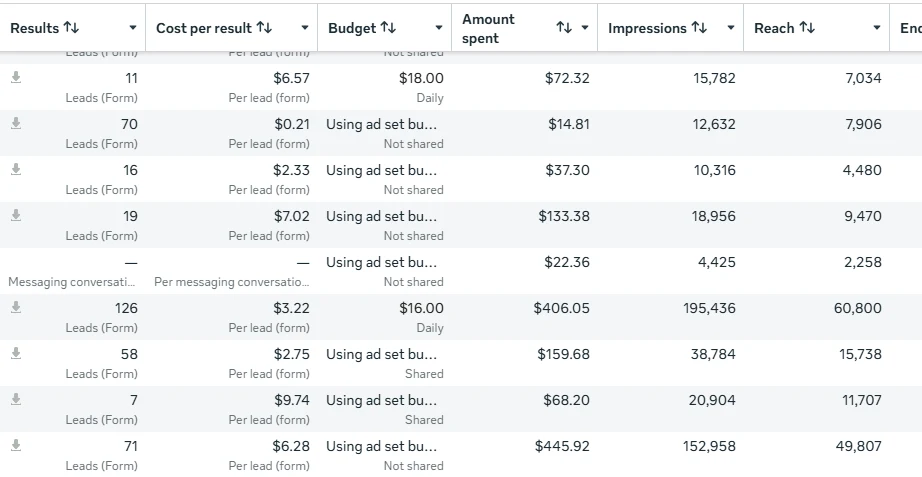
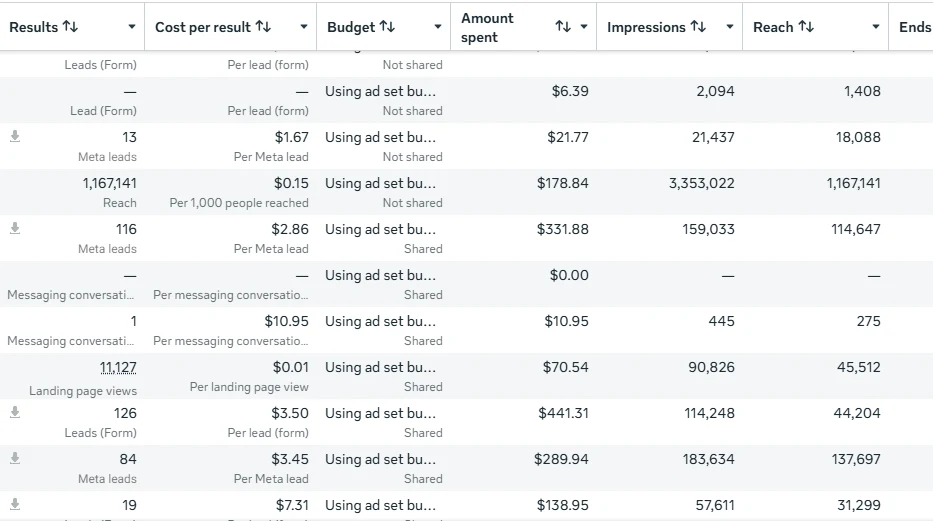
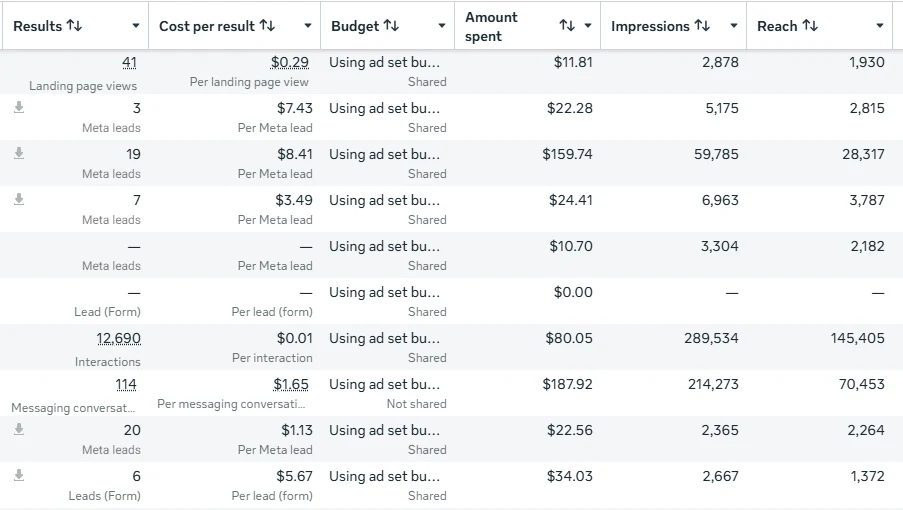
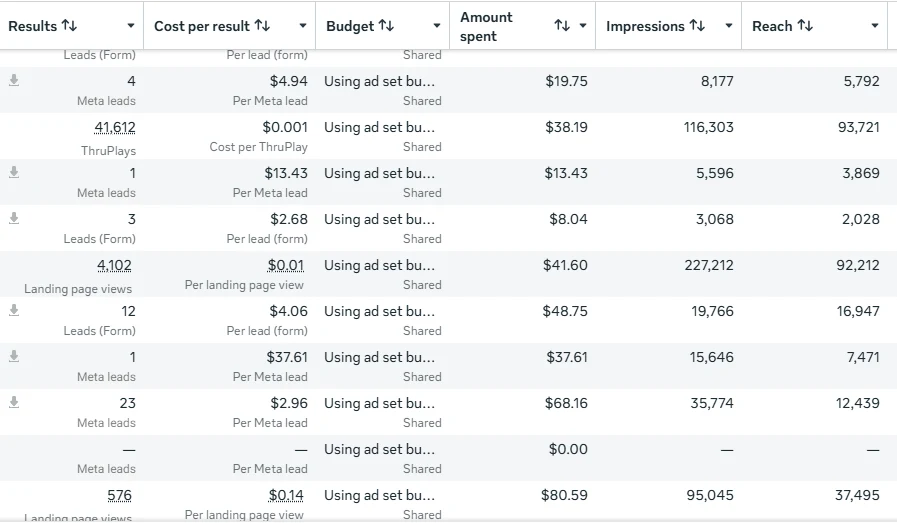
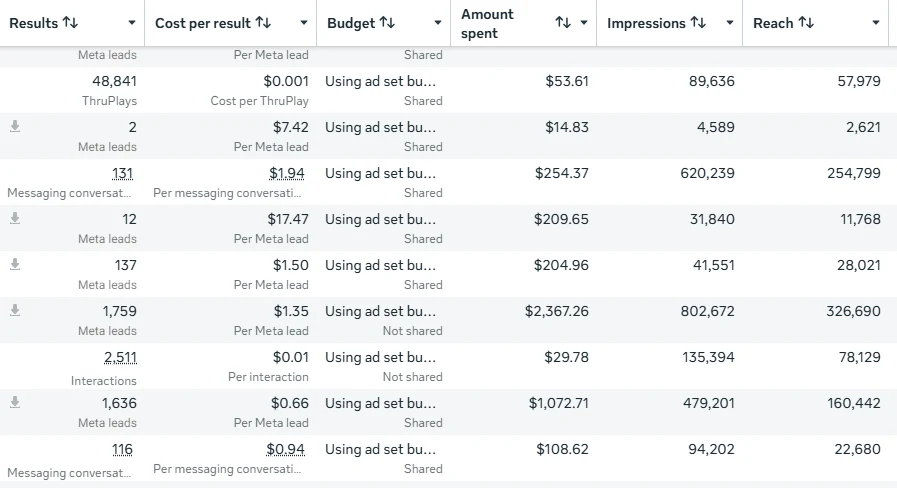
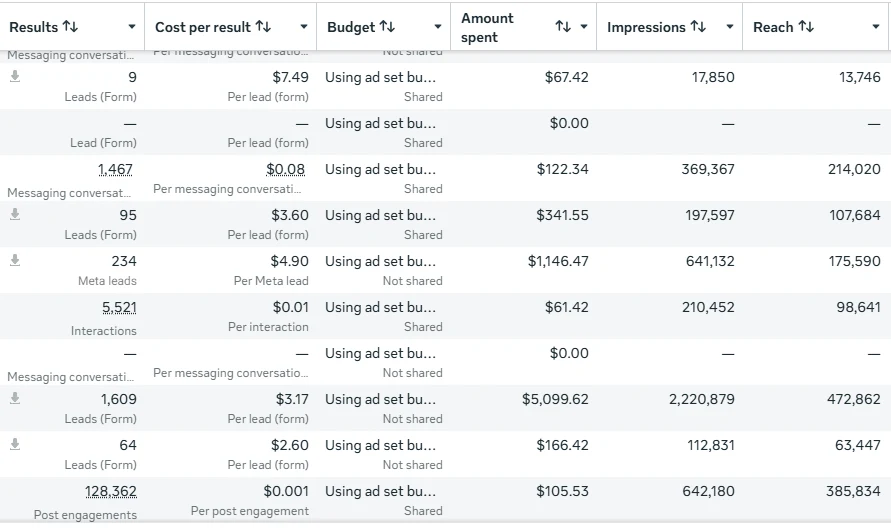
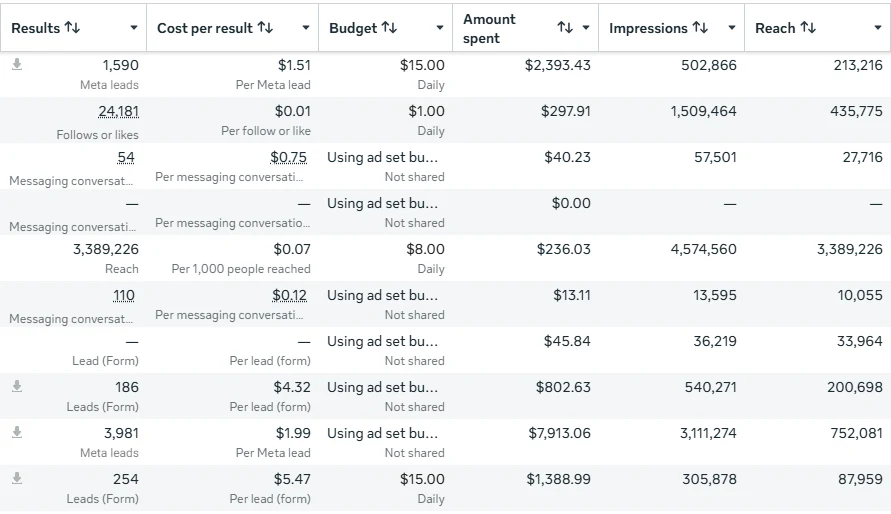
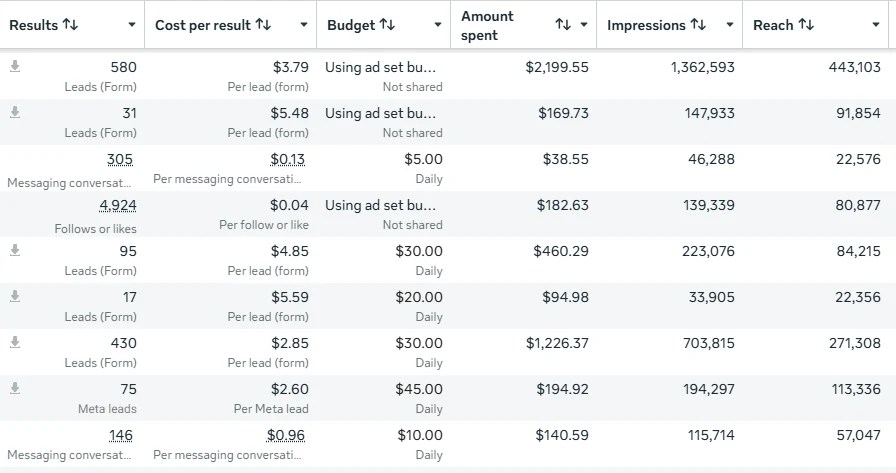
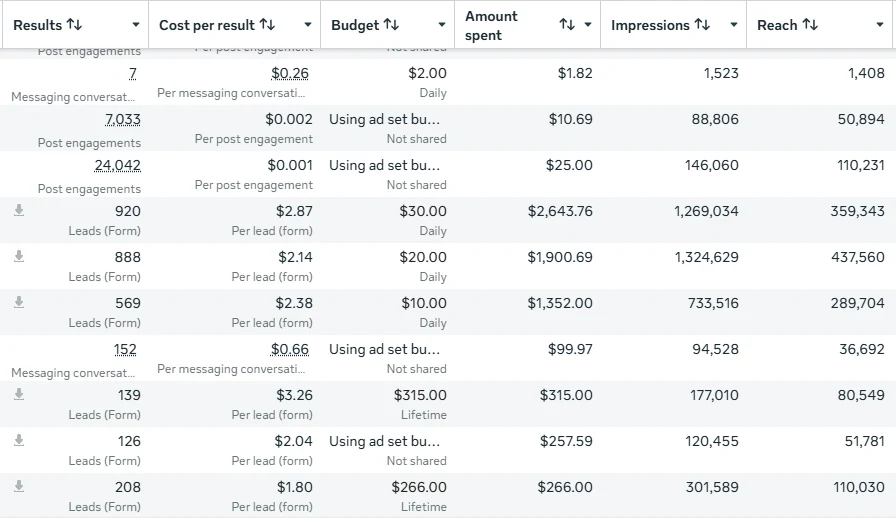
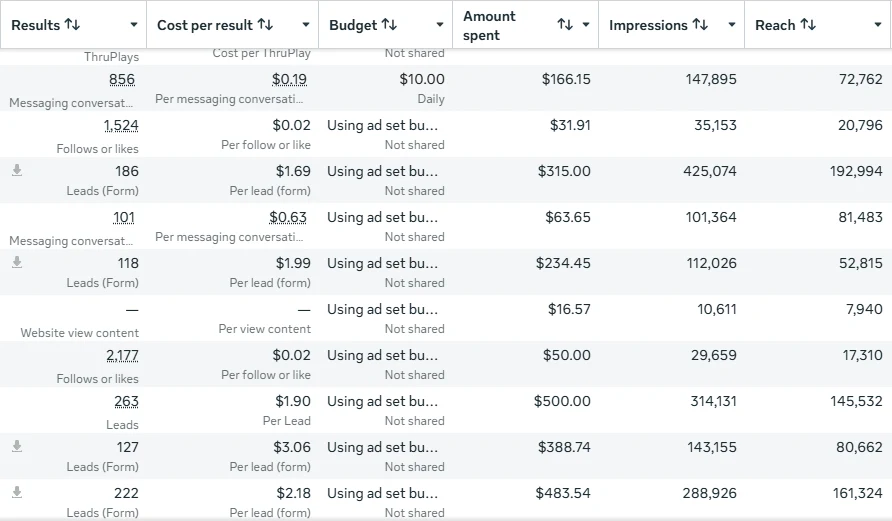
Totals are added up from the ad set rows fully visible in the Meta Ads Manager screenshots. Rows cut off at the edges of a screenshot are left out, so the real totals may be slightly higher.
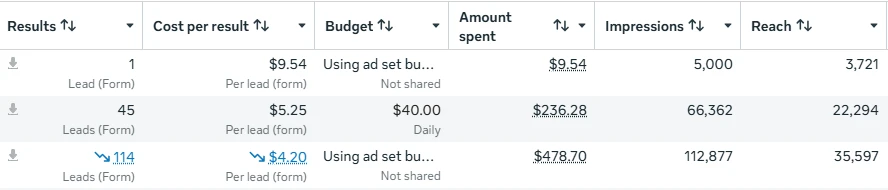
Lead form ads on Facebook and Instagram let interested buyers send their details without leaving the app. The campaign ran across three ad sets, and the best one brought 114 leads at $4.20 each. Out of all 160 leads, 15 converted.
| Ad set | Leads | Cost per lead | Spend | Impressions | Reach |
|---|---|---|---|---|---|
| Ad set 1 | 114 | $4.20 | $478.70 | 112,877 | 35,597 |
| Ad set 2 | 45 | $5.25 | $236.28 | 66,362 | 22,294 |
| Ad set 3 | 1 | $9.54 | $9.54 | 5,000 | 3,721 |
| Total | 160 | $4.53 | $724.52 | 184,239 | – |
Google reported that conversions for the Demand Gen campaign rose by 59 compared with the previous four weeks.
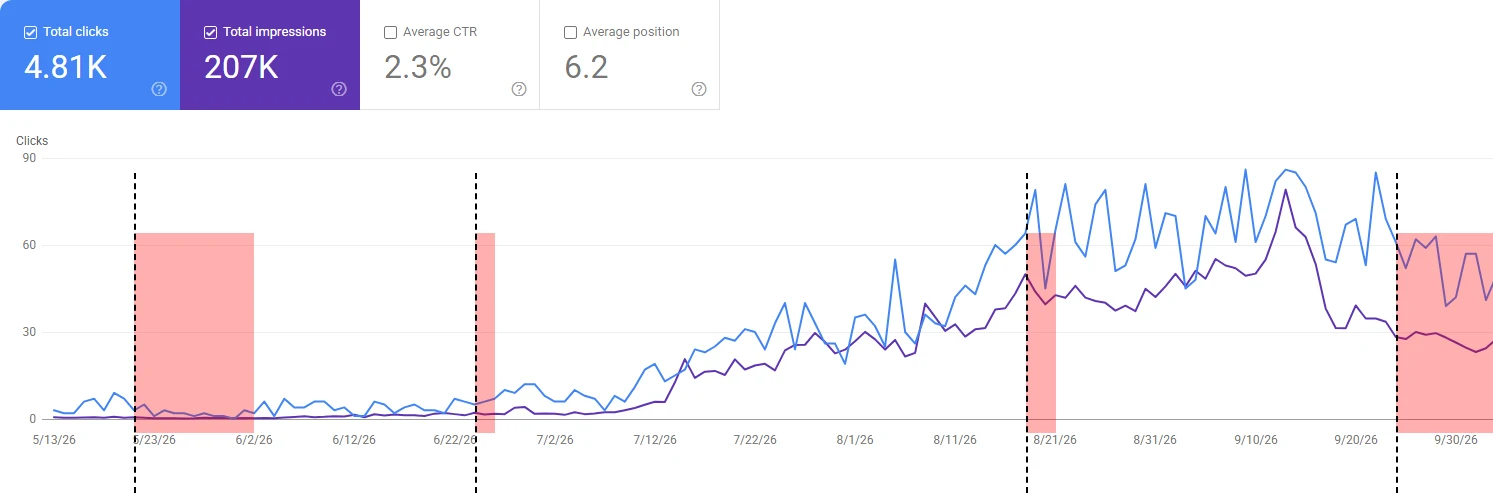
In May 2026 the website got only a handful of visitors from Google each day. After the SEO work, daily clicks climbed steadily from July and reached 60 to 90 clicks a day by September. Over 6 months the site earned 4,810 clicks and 207,000 impressions, with an average position of 6.2, on the first page of Google.
Zahir managed our Meta and Google Ads with real care for our budget. He explained every report clearly, and we started getting serious property inquiries instead of random clicks.
Message me on WhatsApp and I'll look at your current ads for free.